InfoVis Football Scout Tool — 2025
Context and intent
For the Information Visualisation course at Utrecht University, we built a web based tool to explore a large dataset using JavaScript, HTML, and CSS. The main requirement was to design three meaningful advanced visualisations and link them with each other through useful interactions.
We worked in a team of three and started with a lo fi prototype in Figma to test the flow and the cross filtering behaviour before coding.
Concept and outcome
We chose football data because all three of us are interested in the sport, and there is a lot of data available that support meaningful comparisons. The core scenario is that the user is a football manager looking for a player replacement.
The tool is structured into four connected screens:
- Team overview: review your squad and select the player to replace.
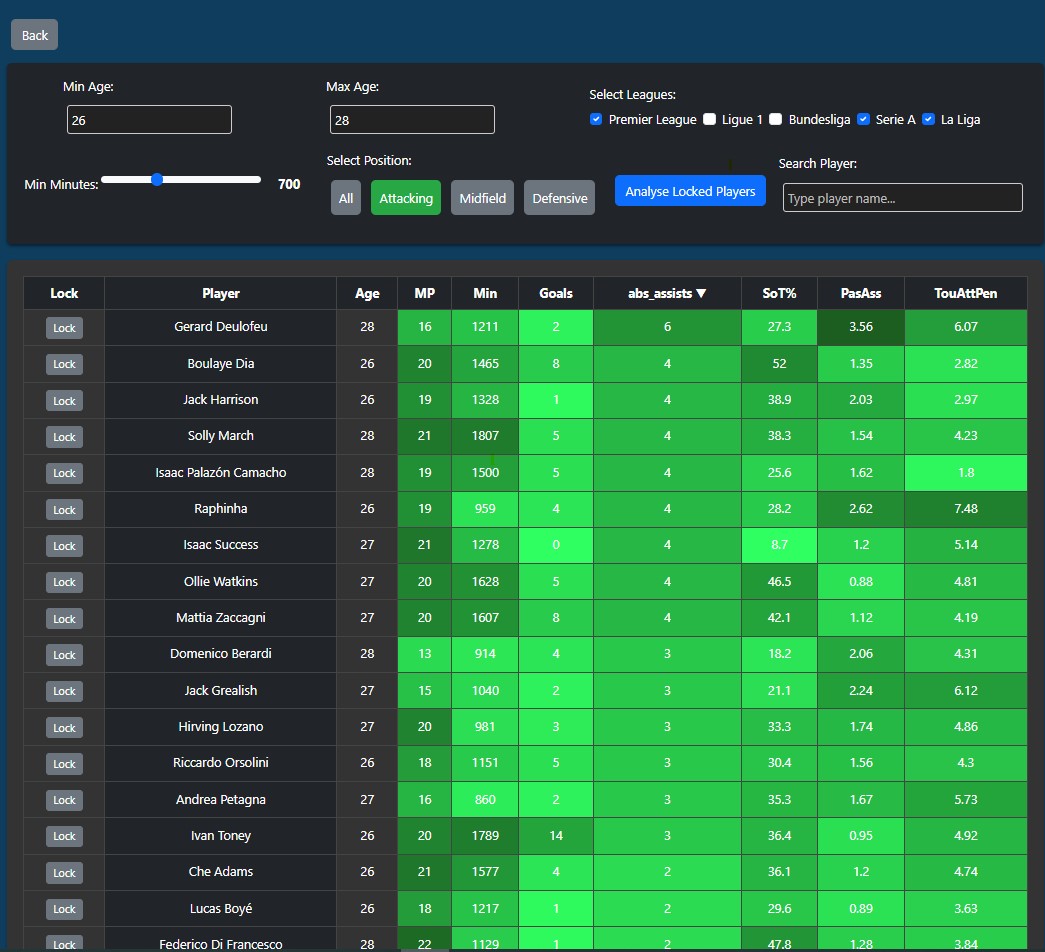
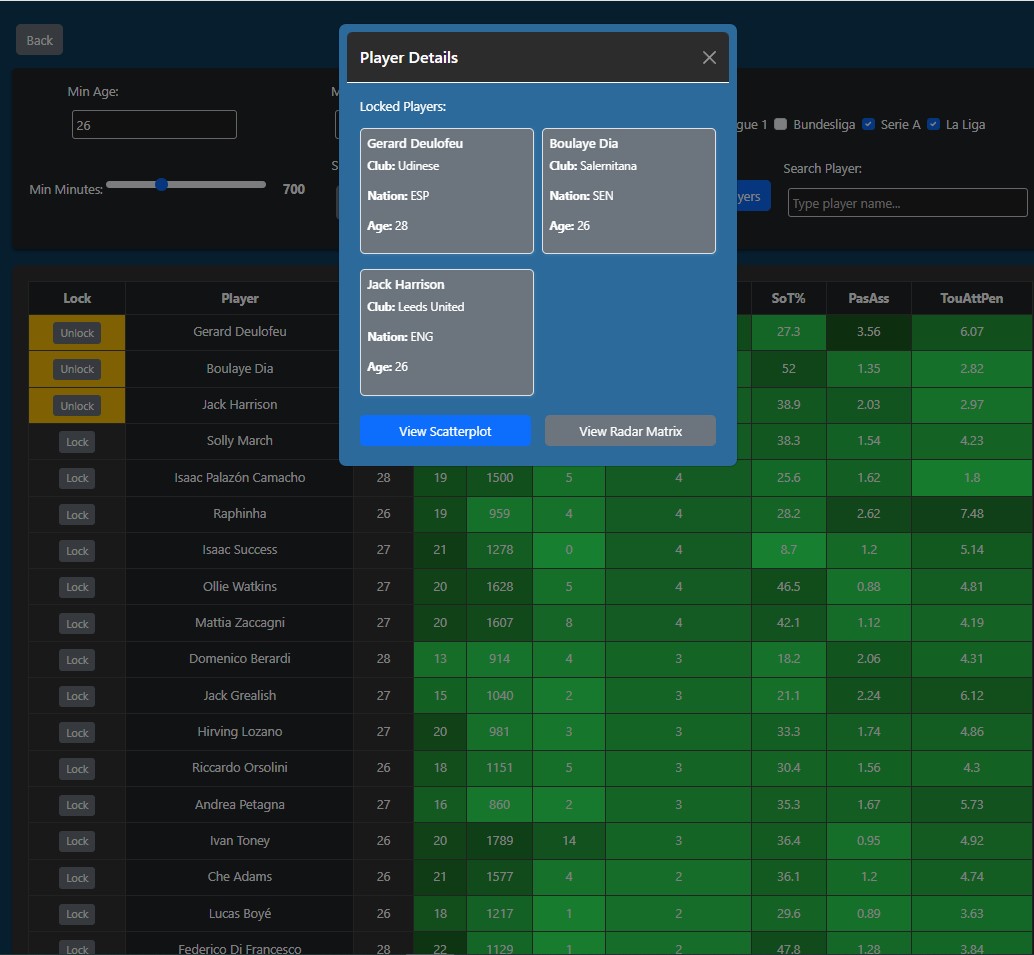
- Heatmap table: filter and shortlist candidates while keeping the selected player as a reference.
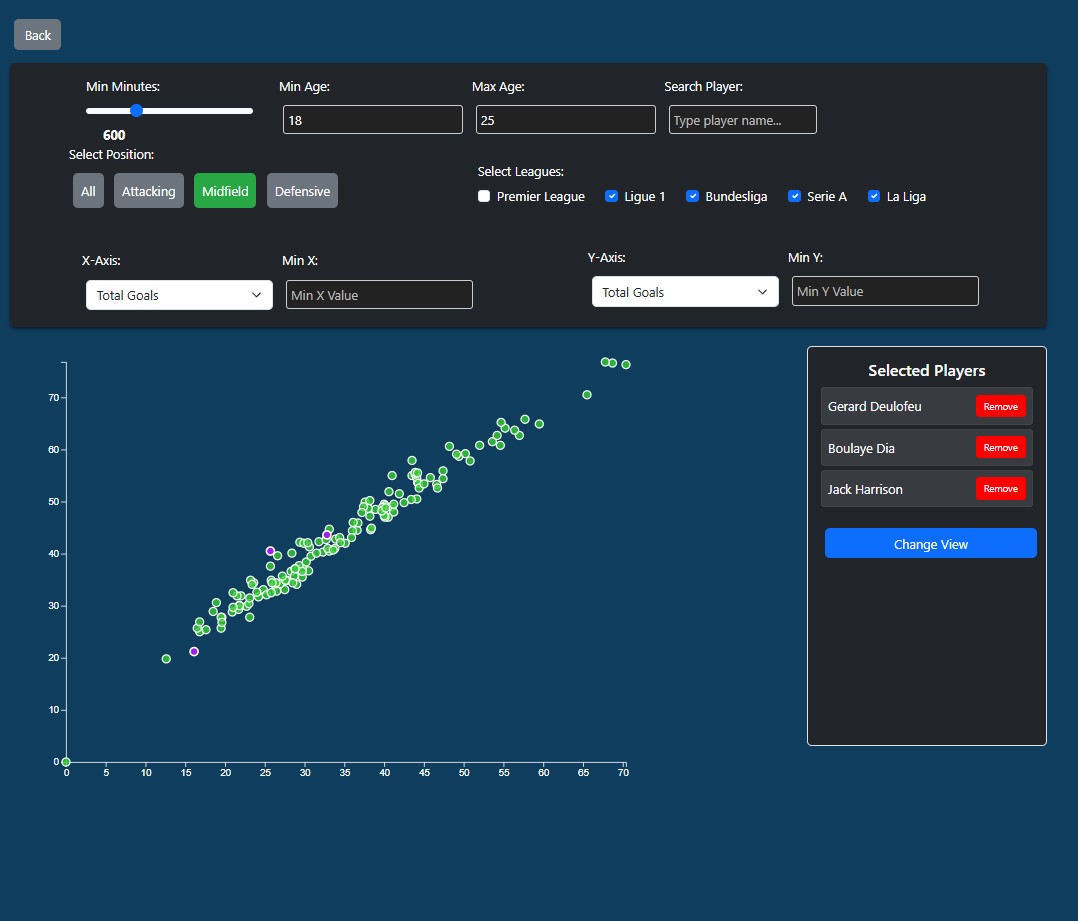
- Scatterplot: compare shortlisted players spatially and identify similar profiles.
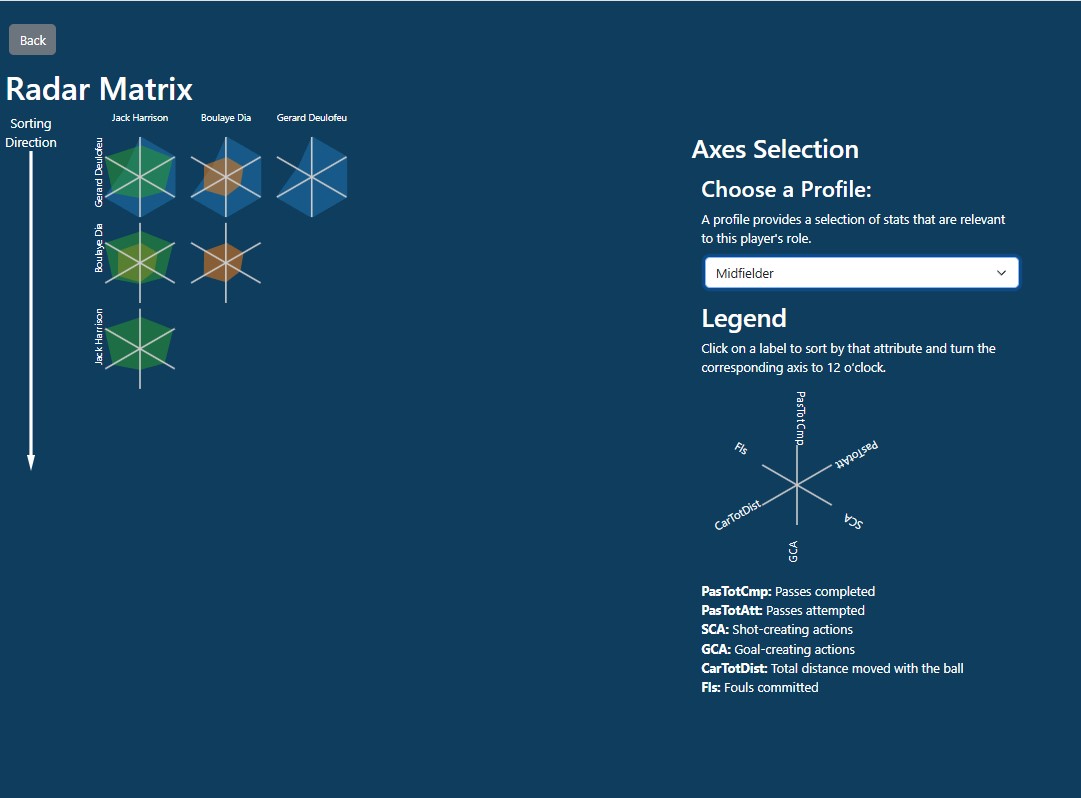
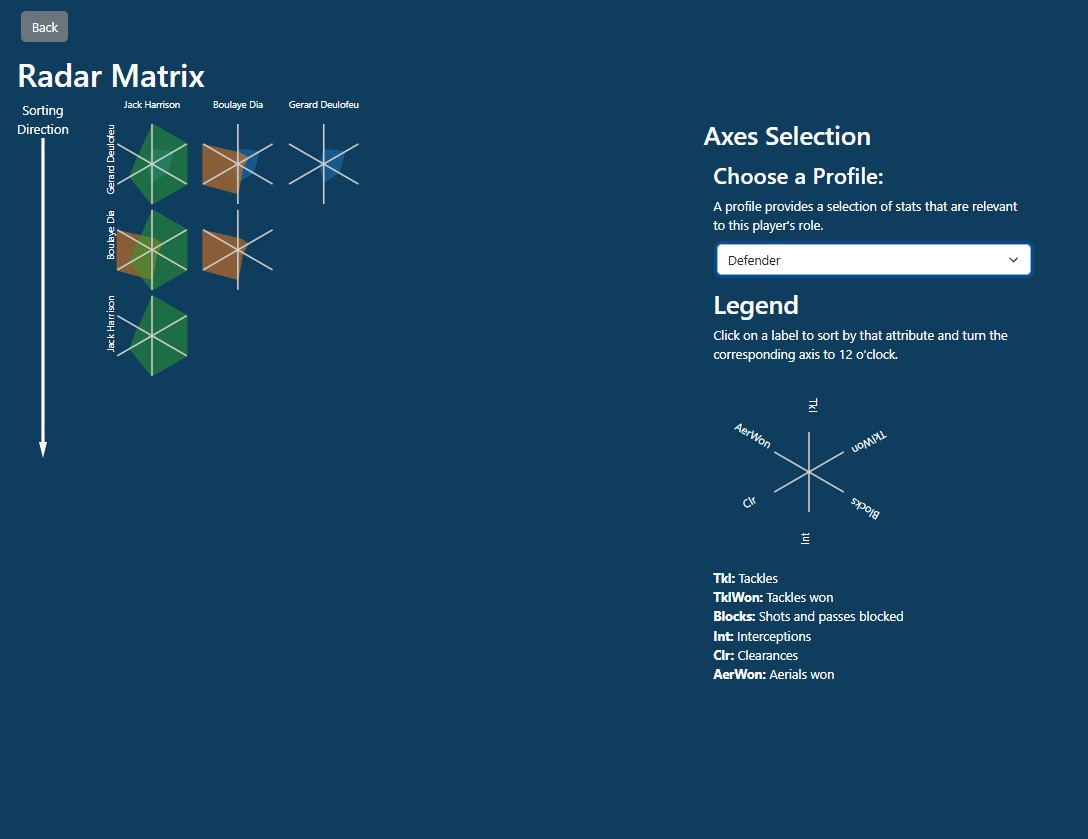
- Radar chart: make a final side by side comparison on selectable attributes.
My role
The roles were equally divided, contributing all with concept, design and implementation. I created the heatmap table and the framework that connected all different visualisations.
Reflection and learning
Our team worked efficiently, with clear communication and internal deadlines, which made the project surprisingly low stress. For me, the biggest takeaway was that JavaScript became much less intimidating once I used it to build something interactive and coherent.
This project directly influenced my confidence to build this portfolio with JavaScript as well.
Project snapshot
Created by Ivan Sladonja, Dorus Keijzer and Roland Wit